
Vol 8 No 1 2023 – 2

Development of enhanced primer sets for detection of Norovirus and Hepatitis A in food samples from Guayaquil (Ecuador) by reverse transcriptase-heminested PCR

E. J. Salazar 1,2*, M. J. Guerrero 3, J. A. Villaquiran 3, K.S. Suárez 4, and J.M. Cevallos 1,5
1Centro de Investigaciones Biotecnológicas del Ecuador, Escuela Superior Politécnica del Litoral, Guayaquil, Ecuador;
2 Facultad de Ciencias Agropecuarias, Universidad Técnica de Babahoyo, Km 7.5 Vía Babahoyo – Montalvo
3 Facultad Ciencias de la Vida, Laboratorio para Investigaciones Biomédicas, Escuela Superior Politécnica del Litoral, Guayaquil, Ecuador;
4Facultad de Ingeniería Mecánica y Ciencias de la Producción, Escuela Superior Politécnica del Litoral, Guayaquil, Ecuador;
5Facultad Ciencias de la Vidas, Escuela Superior Politécnica del Litoral, Km 30.5 Vía Perimetral, P.O. Box 09-01-5863, Guayaquil, Ecuador.
*Correspondence: enriquesalazarll27@hotmail.com ; Tel.: +(593) 98 712 8999; +(593) 42 85 0747.
http://dx.doi.org/10.21931/RB/2023.08.01.2
ABSTRACT
Norovirus (NV) is an infectious biological agent that causes gastrointestinal problems of the original nonbacterial appearance of foodborne illnesses. The genotype of NV responsible for the most frequent NV disease outbreaks is GII, accounting for 60–80% of the cases. Moreover, original and new NV variants are continuously emerging, concurrent with the recent global increase in NV infections. Hepatitis A virus (HAV) is another foodborne pathogen frequently implicated in acute gastroenteritis cases around the world. The virus is transmitted among humans via the fecal-oral route, and infection by HAV causes the most severe form of viral illness acquired from foods. In this study, we implemented primer sets to detect NV genotypes I and II. We also developed primer sets for the detection of HAV. The primers were used in a heminested reverse transcriptase PCR (hnRT-PCR) protocol that was rapid and sensitive for detecting NVG1, NVGII and HAV virus in food. The hnRT-PCR was applied successfully to strawberries and spinach obtained from a local fresh-food market, where we could see NVGI, NVGII and HAV.
Keywords: Norovirus1; Hepatitis A2; gastroenteritis3; genotypes4; NVG15; NVGII6; hnRT-PCR7.
INTRODUCTION
Norovirus (NV), family Caliciviridae, is a major cause of acute viral gastroenteritis in humans 1. Disease onset typically appears between 12 and 48 h after infection, and although symptoms are usually mild and self-limited, they can be severe in immunocompromised patients and the elderly 2. NV disease is considered a foodborne illness, but person-to-person transmission and waterborne outbreaks are also important sources of infection 3. The NV genome is composed of a single-stranded positive-sense RNA (+ssRNA), with approximately 7.7 kb and three open reading frames (ORFs): ORF1, ORF2, and ORF3 4. ORF1 encodes six nonstructural proteins, including the RNA-dependent RNA polymerase (RdRp) 5. ORF2 and ORF3 encode major (VP1) and minor (VP2) structural capsid proteins, respectively 6. VP1 consists of a folded domain (S) and two prominent domains (P) 7. The P1 domain, a central region of the flexible loop, is located between the S and P2 domains 5. The P2 domain is a hypervariable region that binds to the host cell 8.
The stability of VP1 is increased by VP2, which prevents its degradation 5. NV is classified into six groups, genogroups I to VI (GI to GVI), based on the amino acid sequences of the RdRp and VP1 9. The genogroups GI, GII, and GIV, are found in humans 10, and outbreaks appear more frequently within these genogroups 11. GII continuously evolved in an evolutionary pattern every 2 to 3 years 12. This genotype is equivalent to 87% of the occurrence of noroviruses worldwide 13. NV GII.4 Sydney type emerged in Korea between 2012 and 2013, where 60.4% of NV diagnoses showed GII 13. The NV GII strain is difficult to identify the existing RT-PCR because of the continuous variation of the strain. In addition, the primer set does not always have sufficient specificity to detect NV and false positive detection frequently occurs 14.
Hepatitis A virus (HAV) is a hepatotropic virus that belongs to the family Picornaviridae 1,15. The HAV has a single-stranded positive-sense RNA genome of 7.5-kilobase (kb). HAV genome is wrapped up by an icosahedral capsid, formed by up to 60 copies of three surface proteins, VP1, VP2, and VP3 (named 1D, 1B, and 1C), transcribed into one open reading frame (ORF) 16. The single ORF of 2217 to 2280 amino acids of HAVs is divided into P1, P2, and P3 regions. The P1 part contains the capsid polypeptides VP1 to VP4, whereas P2 and P3 regions include the nonstructural polypeptides. 1. Flanking the HAV genome, there are regulatory 5′ and 3’UTRs areas with a small poly-A tail 17. HAV immunogenic neutralization sites are located on the structural surface of proteins 18.
Primates are the only natural host of HAV, and infection confers lifelong protection 19,20. After ingestion, absorption from the gastrointestinal tract, and replication in the liver, HAV is excreted in the bile in high concentrations of viral particles that can be found in stool specimens. HAV transmission occurs by the fecal-oral through direct contact with an HAV-infected person or by consuming HAV-contaminated food or water. The median latency period (i.e., time from exposure to onset of symptoms) is 28 days (range 15 to 50 days) 19—infectivity peaks two weeks before the onset of jaundice and declines one week after the start. Elevating serum alanine aminotransferase [ALT] levels can lead to maximal infectivity in people without jaundice. Viremia can be detected before ALT levels rise, and HAV RNA levels often remain detectable even after ALT levels normalize and symptoms resolve 21.
Hepatitis A begins with symptoms such as fever, loss of appetite, nausea, vomiting, diarrhea, muscle aches, and fatigue. Jaundice, dark-colored urine, or light-colored stools may be present initially or followed by systemic symptoms within a few days if the physical findings include abdominal tenderness, hepatomegaly or splenomegaly 22. In most cases, hepatitis A lasts for several weeks. Recurrence of symptoms with new increases in serum aminotransferase levels occurs in 10% of patients, and relapses can last up to 6 months 12. All-cause mortality is 0.3%, compared to 1.8% among people around age 50. People with underlying chronic liver disease are at increased risk of death. 23.
HAV contamination of food can occur at any stage of growing, harvesting, processing, distribution, or preparation. Foodborne infections can be challenging to detect from routine surveillance data because case patients may have difficulty recalling their dietary history 2 to 6 weeks before illness 15,19, cases may accrue gradually or not be reported, 24, a food item may be focally contaminated 21, some exposed persons may have unrecognized HAV infection, 25, some susceptible persons may have preexisting immunity from a previous infection or vaccination 26, persons who acquire infection through contaminated food are not recognized amid an ongoing high incidence in the community. Cases are geographically scattered over several public health jurisdictions 27.
This study aimed to develop a rapid and sensitive detection method for Norovirus genotypes I and II and Hepatitis A in food matrices of high demand and consumption. The current problem in public health in Ecuador is that many diseases associated with gastrointestinal issues are associated with bacteria and not with viruses; in this context, the identification of Norovirus, specifically genogroup II, which is associated with high cases of foodborne infection, allows to identify the type of disease in relation to the infectious biological agent correctly. Concerning the Hepatitis A virus, many farmers in our country do not carry out good agricultural practices concerning the sanitary quality of the irrigation water used for fruit and vegetable crops, specifically strawberries and spinach, being a route of infection by cross-contamination. Since these foods are not heat-treated in most cases, the risk to public health is considerable.
MATERIALS AND METHODS
Analysis of HAV genomic sequences. The genomic sequences of NV GI, GII, and HAV strains were collected from the National Center for Biotechnical Information (NCBI) genetic sequence database and analyzed using Geneious Prime® 2021.0.3. The current study’s sequences are listed in Tables 1, 2 and 3. Genetic sequences were aligned with Muscle to identify around 500 nucleotides as the target for RT-PCR diagnoses and positive controls. Selected sequences were cloned into a T7-driven vector for in vitro transcription of the favorable rules. Genetic sequences of the gene fragments and primers are shown in Tables 4 and 5.
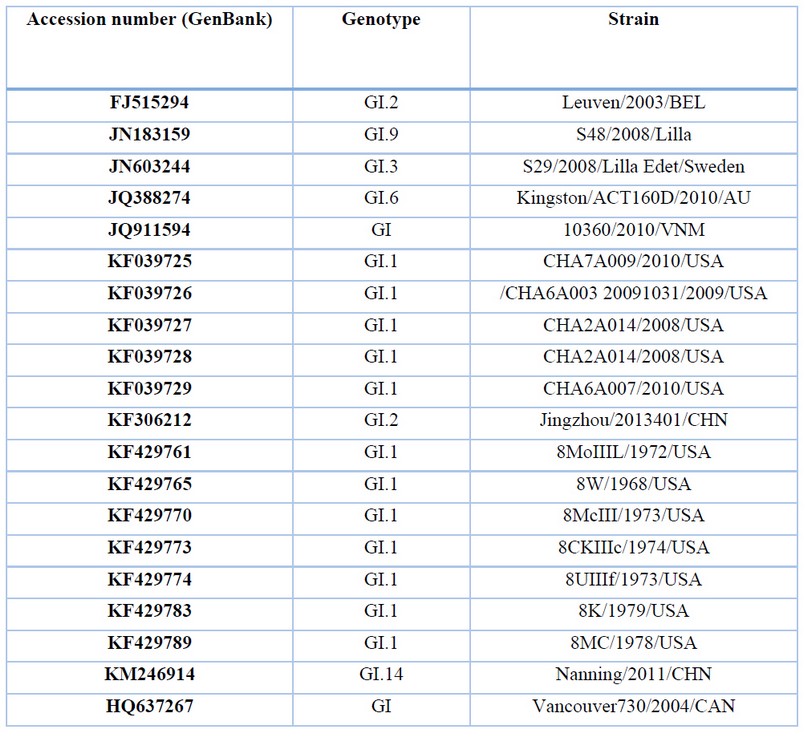
Table 1. Description of NV GI sequences for genetic analysis.
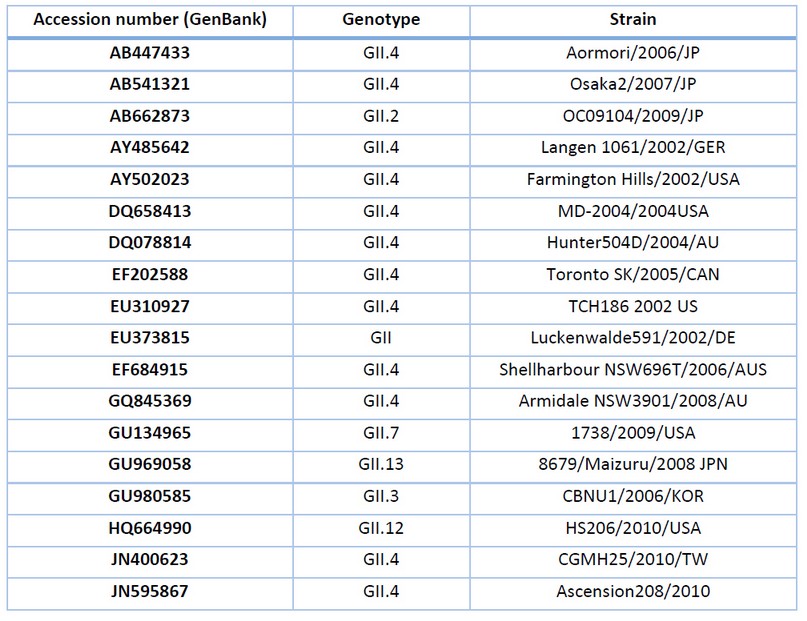
Table 2. Description of NV GII sequences for genetic analysis.
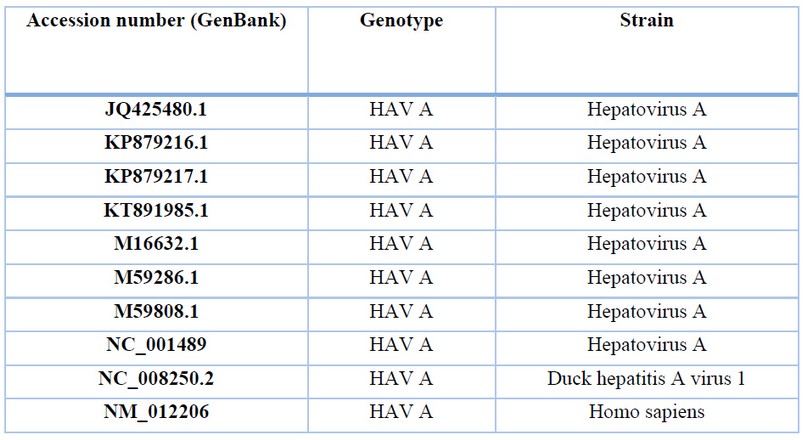
Table 3. Description of HAV sequences for genetic analysis.
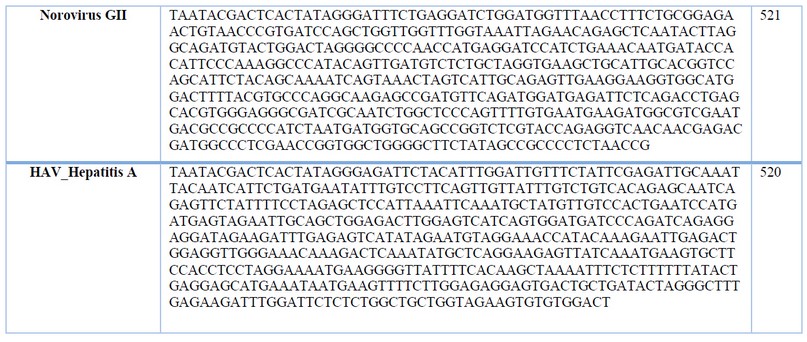
Table 4. Sequence of genes synthesized for positive control and primer design Norovirus (GI And GII); Hepatitis A (HAV) obtained by alignment from strains the genetic sequence database at the National Center for Biotechnical Information (NCBI).
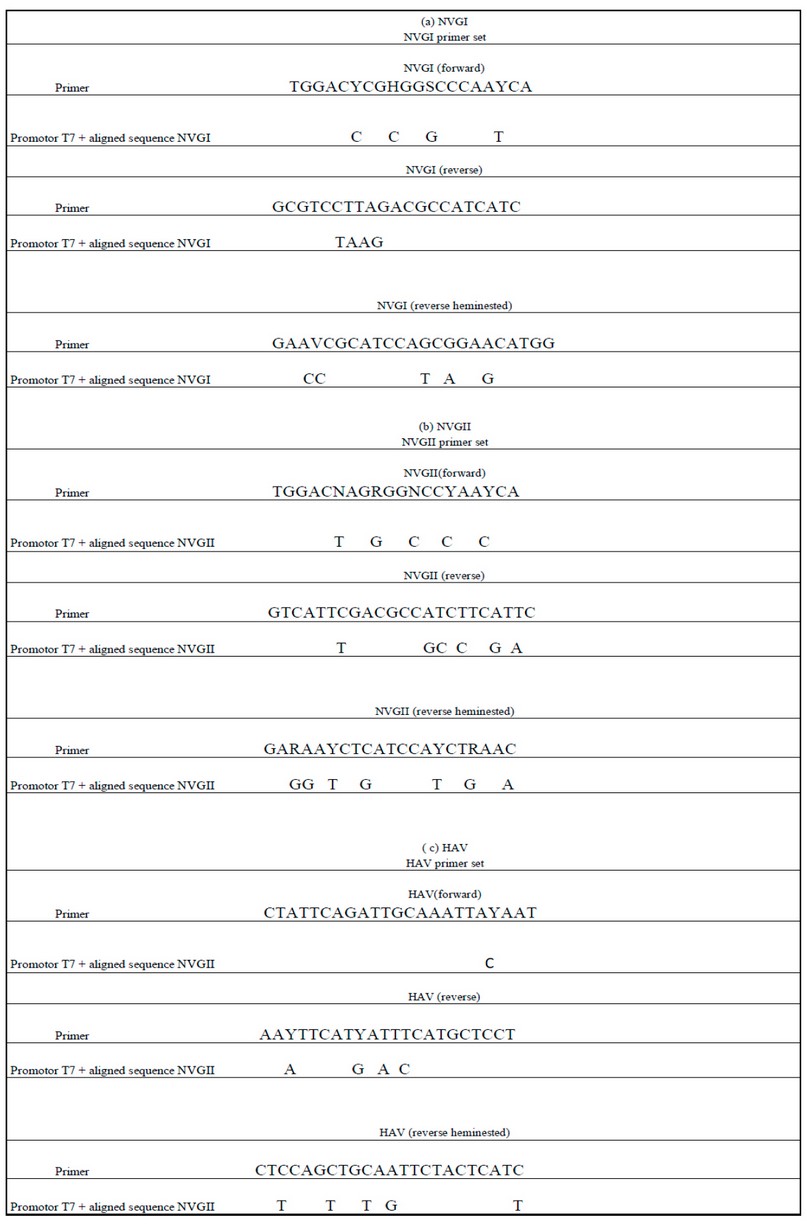
Table 5. The sequence of genes synthesized of NV GI (a) NV GII (b) and HAV (c) obtained by alignment from strains in the genetic sequence database at the National Center for Biotechnical Information (NCBI) were compared to determine consensus identity with sequences of designed primer sets.
Verification of positive controls. Gene fragments were received in a pTop Blunt V2 vector and transformed in DH5alpha Escherichia coli competent cells. Gene fragments were verified by restriction digestion with the following sizes: NV GI 557bp; NV GII 558bp; and HAV 557 bp (Fig. 1).
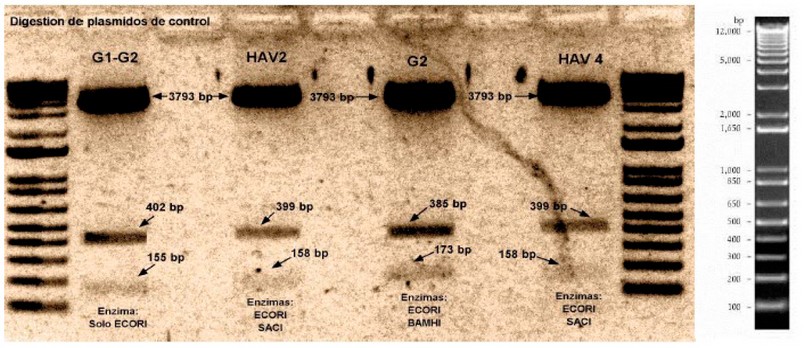
Figure 1. Digestion of plasmid pTop Blunt V2 with an inserted sequence of NVGI, NVGII, and HAV gene.
Primer Design. Specific primers for NVand HAV were designed from conserved regions of ORF1 and ORF2. The expected size for NVGI in the first PCR is 288 bp, and using heminested PCR it is 213 bp, for NVGII the anticipated size of the initial amplification is 286 bp and using heminested PCR the predicted size is 215 bp while for HAV the anticipated length of the initial PCR is 395 bp and using the heminested PCR 160 bp.
Collection of food Samples. This study’s test sample sizes were 25 g (fruit and vegetables like strawberry and spinach), 330 ml (bottled water) and 25 g of sausages. All samples were tested using the relevant matrix-specific test protocols 28. All food samples were tested for NV GI and GII, and HAV. Samples were obtained at the wholesale food market of Mount Sinai, Guayaquil, during October and November of 2020.
Validation of hnRT-PCR. Thoroughly washed strawberries, spinach and sausages were inoculated with in vitro transcribed NV GI, GII and HAV RNA-positive controls. Food samples without inoculation were used as negative controls. The weight of strawberry, spinach and sausage was 25 grams and 300 ml for bottled water 28.
Food sample washed with water (except bottled water sample). It was established as a protocol to inoculate the food with NVGI (600 ng/ul), NVGII (500 ng/ul) and HAV (450 ng/ul), established as a positive control. Subsequently, a process was established by inoculating viral load without food NVGI (600 ng/ul), NVGII (500 ng/ul) and HAV (450 ng/ul) established as the positive control. Positive control was established within the process based on synthetic RNA obtained by reverse transcription of the PCR product of the plasmids.
Experimental protocol. Locally purchased strawberries, spinaches, sausages, and bottled water were used in this study. Food samples (25g) were mixed with 60 ml of elution buffer (50 mM glycine, 100 mM Tris, 1% [wt/vol] beef extract [pH 9.5]) for 15 min at room temperature with constantly shacking (Fig. 2). The elution buffer was then filtered through a 40-m pore size nylon cell strainer (BD Falcon, Basel, Switzerland). The recovered elution buffer was adjusted to pH 7.0 with 9.5 M HCl and centrifuged at 3,500 g for 15 min. The supernatant was transferred to a new tube, and the volume was brought up to 25 ml with phosphate buffer saline and left at 4C overnight. The next day the extract was centrifuged at 3,500 g for 15 min, and the supernatant was then transferred to a Centricon Plus-70 centrifugal filter device (100K NMWL; Millipore, Molsheim, France) and centrifuged at 3,500 g to concentrate viral particles into a volume of ca. 400 ul. The filter device was subsequently rinsed with 200 ul of elution buffer to improve virus recovery 29 (Fig. 2).
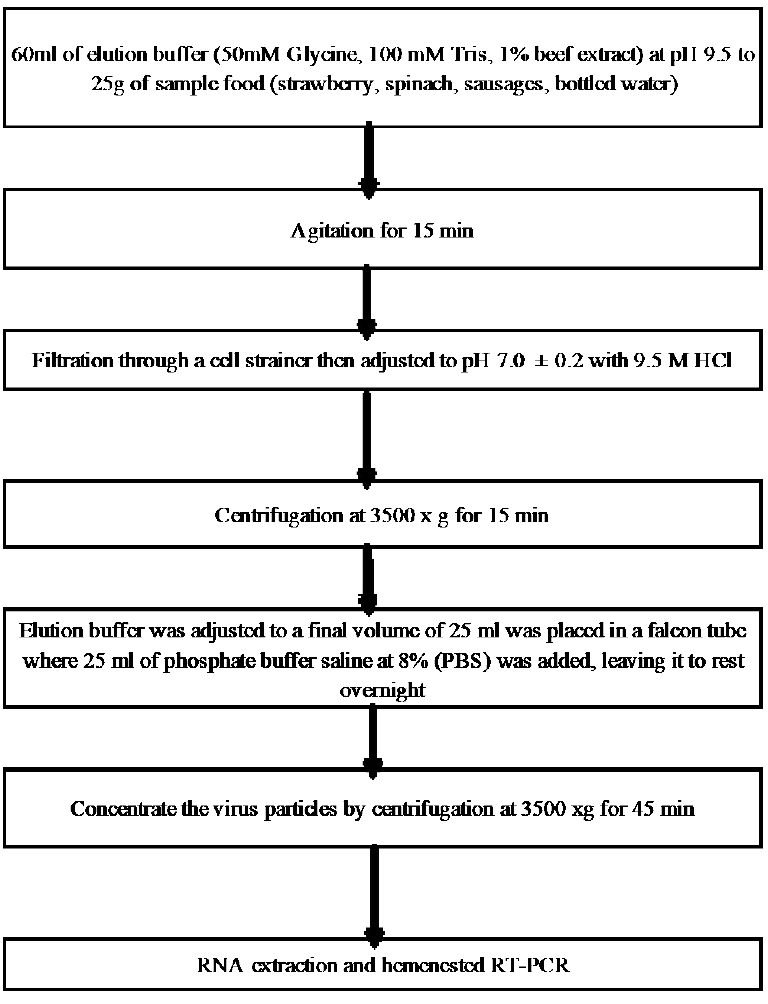
Figure 2. Flow chart of the method.
Viral RNA Extraction. Total RNA was extracted with TRI Reagent according to the manufacturer protocol (12). Total RNA was resuspended in 30 𝜇L of elution buffer and stored at −80∘C until use in the RT-hnPCR assay.
RT-PCR and Heminested PCR. Extracted RNA was reverse-transcribed and amplified using SuperScript III One-Step RT-PCR Kit (Thermo Fisher, USA) following the manufacturer’s instructions. The reaction mixture consisted of 10 ul of reaction buffer, 0.4 ul of Triton x100, 0.2 μM of each primer (NVGI-F/R, NVGII-F/R, HAV-F/R), 0.5 ul of enzyme mix (SuperScript III One-Step RT PCR with Platinum Taq DNA Polymerase), 2 ul of the RNA template, and 11.1 ul and RNase-free water.
The thermocycling protocol was as follows: RT at 50 C for 30 min; initial denaturation at 94 C for 2 min; 40X cycles of 94 C for 30s, annealing at 60 C (NV GI), 55 C (NV GII), and 45 C (HAV), for 30 s, extension at 72 C for 40 s, and a final extension at 72 C for 5 min.
For the heminested PCR step, 1 ul of the RT-PCR reaction was mixed with 2 ul of 10X reaction buffer, 1 ul of 50mM MgCl2, 0.4 ul of 10uM dNTPs, 1 ul of 0.2uM primers, 0.08 ul Platinum Taq DNA Polymerase (Invitrogen) and 14.52 ul of RNase-free water. PCR conditions were as follows: initial denaturation at 94∘C for 2min, 40 cycles of denaturation at 94∘C for 30s, annealing at each optimal annealing temperature (Tables 6, 7 and 8) for 30 s, extension at 72∘C for 40 s, and a final extension at 72∘C for 5min.
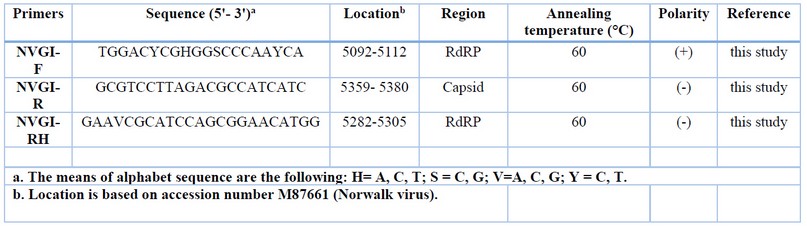
Table 6: Information of NV GI primer sets
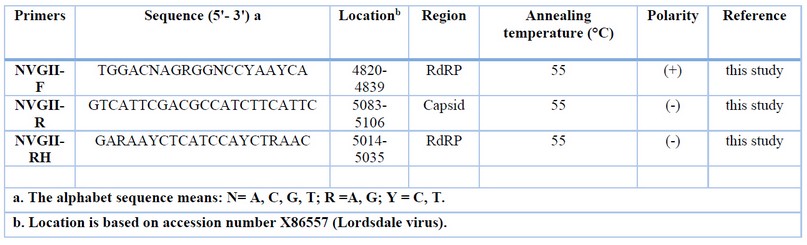
Table 7: Information of NV GII primer sets
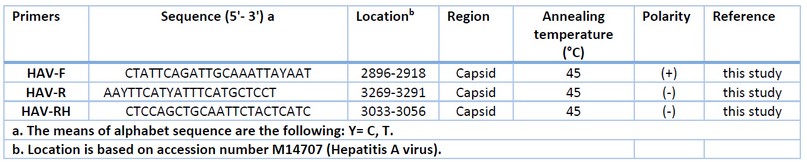
Tabla 8: Information of HAV primer sets
Analysis of PCR Products. The RT-PCR and heminested PCR products were analyzed using 2% agarose gel electrophoresis in TAE buffer. Bands were visualized with Sbyr Safe (Invitrogen, USA).
RESULTS
To evaluate the efficiency of new primer sets (NVGI-F/R, NVGII-F/R and HAV-F/R) to detect NV and HAV, we used RT-PCR followed by a heminested PCR to improve the sensitivity of the current diagnostic. To this end, four food samples were collected in the local wholesale food market to obtain contaminating viral RNA and diagnose for NV GI, GII and HAV. The presence of RT-PCR inhibitors was evaluated as previously described 29.
The RNA extraction method was also evaluated in conjunction with the food sample treatment process to avoid inhibiting viral RNA by substances present in them (phenols, vitamins, proteins, carbohydrates). This was evidenced since when amplifying the genetic material, amplification of the bands was observed in the food samples that were intentionally inoculated with the virus (NVGI / GII and HAV). The method of inhibiting substances inherent to the food 29 does not influence the extraction of genetic material; therefore, the process is validated concerning the results obtained.
NVGI was detected in the strawberry and spinaches samples. NVGII was detected in spinaches, while HAV was detected in bottled water. Each virus showed a clear amplification product at 213pb, 215 and 160pb, respectively (Fig 3, 4, 5, 6, 7, 8).
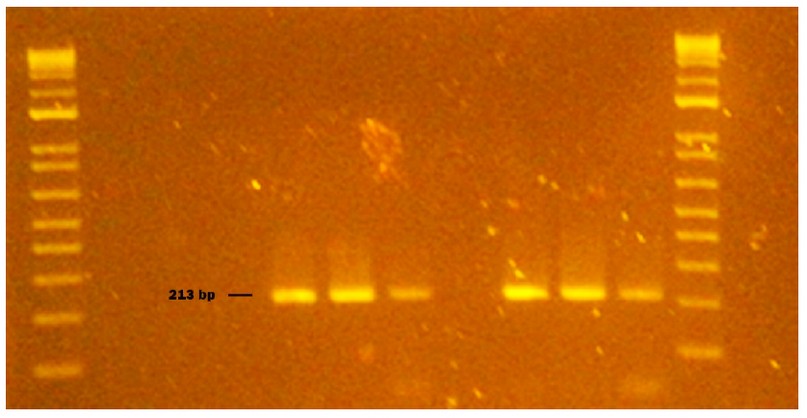
Figure 3. Genogroup GI NV obtained from naturally contaminated food during sampling from October to November 2020 in Monte Sinai, Guayaquil- Ecuador. Lanes 1 and 14: DNA ladder 12000 pb; lane 2 negative control PCR; lane 3 extraction control; lane 4 NVGI identified in strawberry (213pb); lane 5 washed strawberry sample; lane 6 strawberry inoculated with NVGI (Positive Control); lane 7 NVGI virus inoculated without strawberry (Positive Control); lane 8 sausage sample; lane 9 washed sausage sample; lane 10 sausages inoculated with NVGI (Positive Control); lane 11 NVGI virus inoculated without sausage (Positive Control); lane 12 bottled water sample; lane 13 NVGI Positive Control (Synthetic RNA). Samples were analyzed in 2 % agarose gels and stained with cyanine dye.
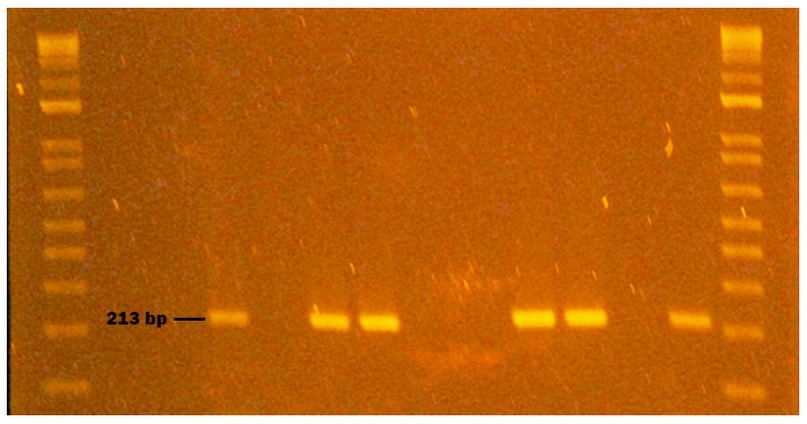
Figure 4. Genogroup GI NV obtained from naturally contaminated food during sampling from October to November 2020 in Monte Sinai, Guayaquil- Ecuador. Lanes 1 and 12: DNA ladder 12000 pb; lane 2 negative control PCR; lane 3 extraction control; lane 4 bottled water sample; lane 5 bottled water sample inoculated with NVGI (Positive Control); lane 6; NVGI virus inoculated without bottled water (Positive Control); lane 7 NVGI identified in spinach (213pb); lane 8 washed spinach; lane 9 spinach inoculated with NVGI (Positive Control); lane 10 NVGI virus inoculated without spinach(Positive Control); lane 11 NVGI Positive Control (Synthetic RNA). Samples were analyzed in 2 % agarose gels and stained with cyanine dye.
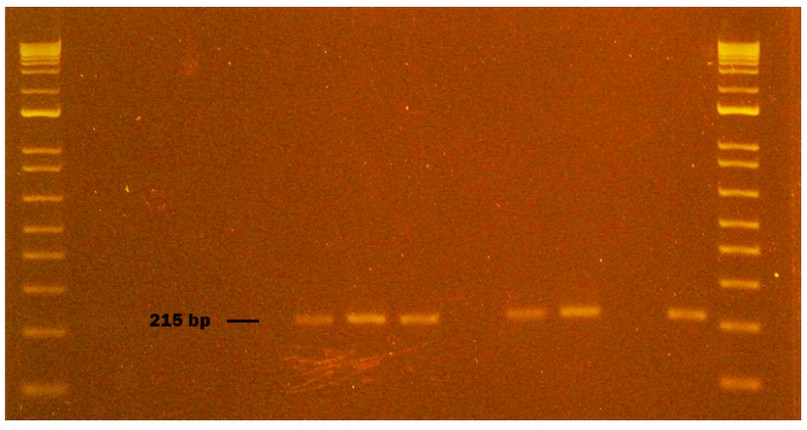
Figure 5. Genogroup GII NV obtained from naturally contaminated food during sampling from October to November 2020 in Monte Sinai, Guayaquil- Ecuador. Lanes 1 and 14: DNA ladder 12000 pb; lane 2 negative control PCR; lane 3 extraction control; lane 4 sausage sample; lane 5 washed sausage sample; lane 6 sausage inoculated with NVGII (Positive Control); lane 7 NVGII virus inoculated without sausage (Positive Control); lane 8 NVGII identified in spinach (215pb); lane 9 washed spinach sample; lane 10 spinach inoculated with NVGII (Positive Control); lane 11 NVGII virus inoculated without spinach (Positive Control); lane 12 strawberry sample; lane 13 NVGII Positive Control (Synthetic RNA). Samples were analyzed in 2 % agarose gels and stained with cyanine dye.
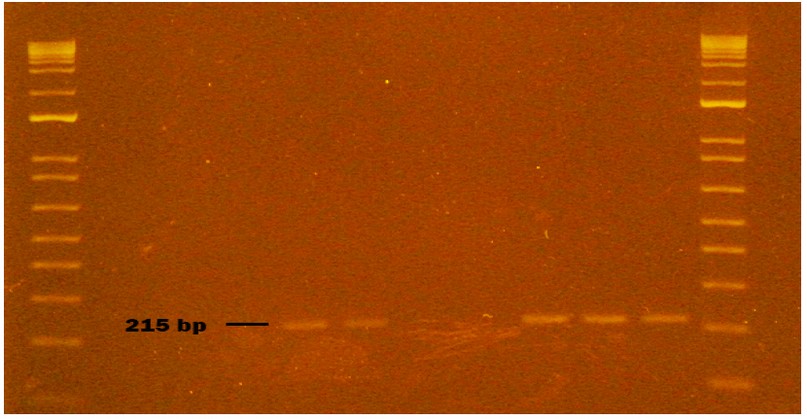
Figure 6. Genogroup GII NV obtained from naturally contaminated food during sampling from October to November 2020 in Monte Sinai, Guayaquil- Ecuador. Lanes 1 and 12: DNA ladder 12000 pb; lane 2 negative control PCR; lane 3 extraction control; lane 4 washed strawberry sample; lane 5 strawberry sample inoculated with NVGII (Positive Control); lane 6 NVGII virus inoculated without strawberry (Positive Control); lane 7 bottled water sample; lane 8 bottled water sample (duplicate); lane 9 bottled water inoculated with NVGII (Positive Control); lane 10 NVGII virus inoculated without bottled water (Positive Control); lane 11 NVGII Positive Control (Synthetic RNA). Samples were analyzed in 2 % agarose gels and stained with cyanine dye.
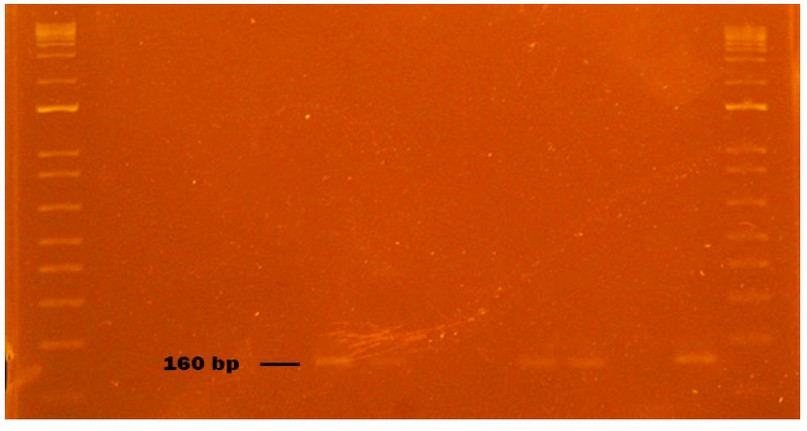
Figure 7. HAV virus obtained from naturally contaminated food during sampling from October to November 2020 in Monte Sinai, Guayaquil- Ecuador. Lanes 1 and 14: DNA ladder 12000 pb; lane 2 negative control PCR; lane 3 extraction control; lane 4 sausage sample; lane 5 washed sausage samp2le; lane 6 sausage inoculated with HAV (Positive Control); lane 7 HAV virus inoculated without sausage (Positive Control); lane 8 spinach sample; lane 9 washed spinach sample; lane 10 spinach inoculated with HAV (Positive Control); lane 11 HAV virus inoculated without spinach (Positive Control); lane 12 strawberry sample; lane 13 NVGII Positive Control (Synthetic RNA). Samples were analyzed in 2 % agarose gels and stained with cyanine dye.
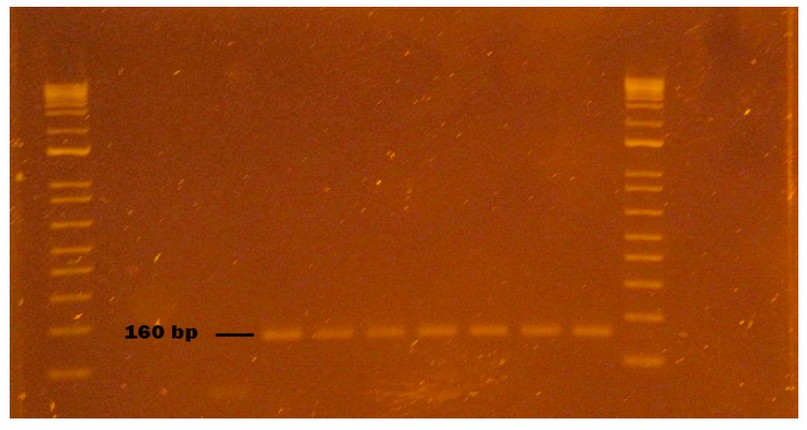
Figure 8. HAV virus obtained from naturally contaminated food during sampling from October to November 2020 in Monte Sinai, Guayaquil- Ecuador. Lanes 1 and 12: DNA ladder 12000 pb; lane 2 negative control PCR; lane 3 extraction control; lane 4 washed strawberry sample; lane 5 strawberry sample inoculated with HAV (Positive Control); lane 6 HAV virus inoculated without strawberry (Positive Control); lane 7 HAV identified in a bottled water sample (160pb); lane 8 HAV identified in bottled water sample duplicate (160pb); lane 9 bottled water inoculated with HAV (Positive Control); lane 10 HAV virus inoculated without bottled water (Positive Control); lane 11 HAV Positive Control (Synthetic RNA). Samples were analyzed in 2 % agarose gels and stained with cyanine dye.
To evaluate the primers (NVGI-F/R, NVGII-F/R and HAV-F/R), 57 samples were amplified from the 4 samples selected in the Mount Sinai market and duplicated to the schematization of the proposed design. Of the 57 samples, 12 (21 %) were positive for the NVGI presence. In the case of NVGII, their presence was detected in 11 (19.3 %) of the analyzed samples. In 12 samples (21 %) HAV was detected with primers designed for HAV detection.
Except for the negative control, that is, they do not contain the genetic material; the rest were amplified, demonstrating the validation of the NV GI, NVGII, and HAV detection method through the design of the primers of the present study.
DISCUSSION
In the USA, an estimated 570–800 people die annually from diseases associated with NV infection. Outbreaks of the virus occur regularly, and new variants are identified worldwide every 2 to 3 years 30.
The widespread use of RT-PCR and Heminested PCR for NV and HAV detection can be attributed to its superior sensitivity compared to other methods 31. Virus detection is susceptible in food because, in most cases, the viral load is low; the virus does not infect food and therefore does not replicate its genetic material. Before extracting RNA from the food, we recommend inhibiting any substance that is part of the food such as phenols, vitamins, proteins, and carbohydrates, using the method described as an experimental protocol 29.
Norovirus GI was detected in strawberries and spinach, Norovirus GII in spinach, and HAV in bottled water. The virus’s origin or source of contamination of the food is unknown. Contaminated water for plant irrigation or cross-contamination by sick food handlers can be a possible source of viral infection.
The food handler is an essential link in NV transmission, being epidemiologically involved in 80 % of the NV outbreaks in Belgium 32.
Contamination of food with HAV can occur anywhere in the food chain, from farm to fork. Contact with incorrectly treated sewage or sewage-polluted water, infected food handlers and, to a lesser extent, contaminated surfaces represent the most common routes of HAV contamination in food. Approximately 2–7% of all HAV outbreaks worldwide can be attributed to contaminated food.
In the present study, we developed specific primers to detect NV GI, GII and HAV, targeting ORF1, ORF2 and capsid genes, respectively. We used a one-step RT-PCR and heminested PCR protocol to enhance further our ability to detect human enteric food viruses. The study carried out is unprecedented in Ecuador because the presence of the virus has not been evaluated in food in our country. The results obtained in samples such as strawberries, spinach and bottled water in a popular sector of the city of Guayaquil suggest that gastrointestinal diseases in the city may have been crucial viral etiology besides bacterial contamination.
Our study showed that the NVGI-F/R, NVGII-F/R and HAV-F/R primer sets could be necessary for the epidemiological diagnosis of NVGI, NVGII and HAV considering the method of extraction and inhibition of food-specific substances that could inhibit or degrade viral RNA in food matrices.
The Biplot shows that only bottled water has a strong relationship with the presence of HA. Other relationships are observed, although not as strong, such as spinach with the presence of N.GI and N.GII. Sausages and strawberries show connections with the absence of pathogens.
The Biplot obtained through the multiple correspondence analysis (Fig.9) shows the significant relationship between bottled water and the presence of Hepatitis A (Val-p = 0.004). It also shows a relationship (not significant) between spinach and the presence of Norovirus GI and GII (p-value > 0.05). Fisher’s (Table 9) test was developed to determine the relationship between the presence of viruses and selected food matrices.
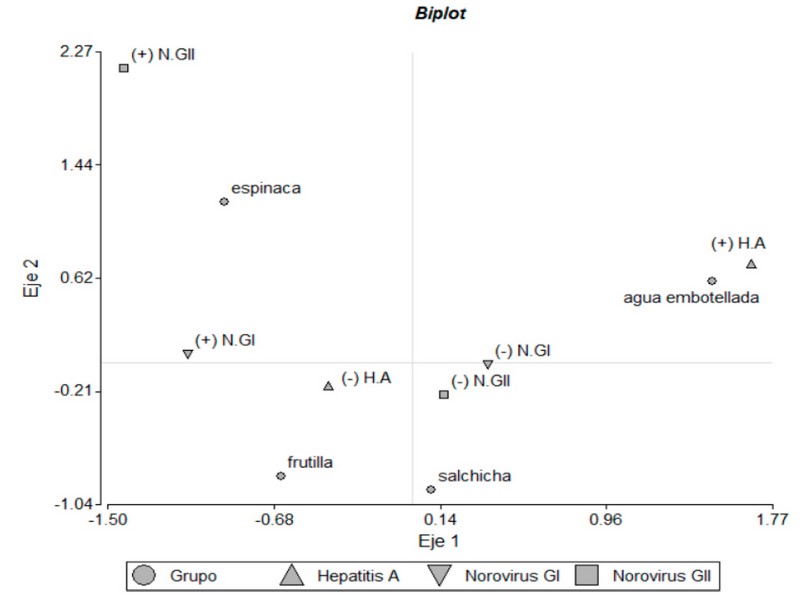
Figure 9: Biplot obtained through the A. Multiple Correspondence, which shows the relationships between pathogens and food groups.
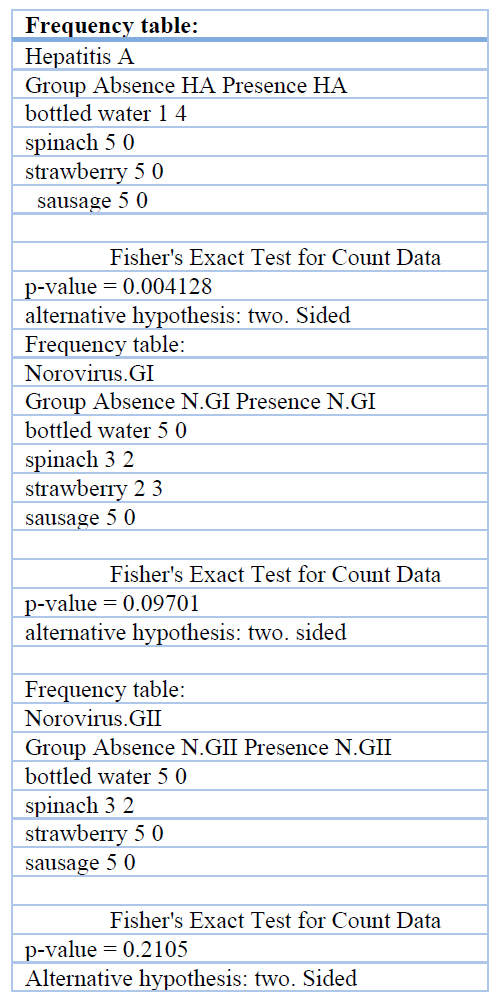
Table 9 Statistical support Fisher’s exact test, for Annexes or complementary material
This study is very relevant in our country in the field of public health and food safety because the presence of these pathogens in food shows that the gastrointestinal problems associated with the population are not exclusively caused by bacteria, which a later study raises in determining in which other types of foods it is likely to detect viral load by Nv and HAV concerning a risk matrix.
In the case of viruses such as Hepatitis A and Norovirus present in spinach, strawberries and water samples, they show that many gastrointestinal problems that occur in Ecuador may not necessarily be caused by bacteria but also by viruses.
CONCLUSIONS
Foodborne diseases are a public health problem worldwide. In the case of biological agents responsible for foodborne illnesses, it is common but largely underdiagnosed.
Norovirus and Hepatitis A are two classes of viruses that have been diagnosed within this group as the main ones responsible for foodborne illnesses, even according to reports documented by the United States Center for Disease Control and Prevention (CDC), 50% of Gastrointestinal disease in the American population is due to Norovirus, which can infect with a relatively low dose.
The great challenge of this research work was to develop a method that allows determining the presence of Norovirus and Hepatitis A in food, considering how complex it is to detect viruses in them because the food as such does not provide the requirements that the obligate intracellular parasite required to carry out the process of replication and increase in viral load.
To detect the viral load in food matrices such as strawberries, spinach, water and sausages, it was previously necessary to inhibit compounds that are part of the chemical composition of the food, such as phenols, vitamins, proteins and carbohydrates, to avoid inhibition of the genetic material of the virus present. on the surface of the food.
The importance of this work was that through a good approach in developing the technique used to detect Hepatitis A and Norovirus in food matrices sampled in the city of Guayaquil, it has identified the presence of these infectious biological agents and probably the association of diseases. Significant foodborne infections associated with transmission by food handlers and sewage-contaminated food for these viruses. According to reports from the Ministry of Public Health in Ecuador, there are no reports related to gastrointestinal problems due to viral origin (Norovirus), which entails a greater challenge in properly identifying the origin of the disease and the palliative treatments applied to sick or dying people. recovery process. It is important to note that complex mixtures of human and animal viruses and other pathogens can be present in a single food, creating the potential for recombination or genetic rearrangement and thus further expansion of the diversity of these pathogens. Bringing together expertise from veterinary, food and clinical microbiology can help unravel these complexities and identify areas for intervention and prevention.
Author Contributions: «Conceptualization, E. J. Salazar and M.J. Guerrero.; methodology, E. J. Salazar.; software, M.J. Guerrero.; validation E. J Salazar, K.S. Suárez. and J.A. Villaquiran.; formal analysis M.J.Guerrero.; investigation, E.J. Salazar.; resources, J.M. Cevallos.; data curation M. J. Guerrero.; writing—original draft preparation, E.J. Salazar.; writing—review and editing, J.M. Cevallos.; visualization, E.J.Salazar.; supervision, J.M.Cevallos.; project administration, M.J.Guerrero.; funding acquisition, J.M.Cevallos..
Funding: This research received no external funding.
Institutional Review Board Statement: Not applicable
Informed Consent Statement: «Not applicable.» for studies not involving humans.
Acknowledgments: This research was funded by the Coorporación Ecuatoriana para el Desarrollo de la Investigacion y la Academia (CEDIA) through grant CEPRA-XI-2017-02 and Flemish Interuniversities Council- University Development Co-operation (VLIR-UOS) through grant VLIR-Network- Ecuador.
Conflicts of Interest: There are no conflicts of interest
REFERENCES
1. Morillo, S. G., A. Cili, R.D.C.C Carmona and M.D.C.S.T Timenetsky. Investigation and molecular characterization of Norovirus in Sao Paulo State, Brazil. Braz. J. Microbiol 2008
2. Griffin SM, Brinkman NE, Hedrick EJ, Rhodes ER, Fout GS. Comparison of nucleic acid extraction and reverse transcription-qPCR approaches for detection of GI and GII noroviruses in drinking water. J Virol Methods. 2014;199.
3. Barclay L, Park GW, Vega E, Hall A, Parashar U, Vinjé J, et al. Infection control for Norovirus. Vol. 20, Clinical Microbiology and Infection. 2014.
4. Green KY. Caliciviridae: The noroviruses. In: Fields Virology: Sixth Edition. 2013.
5. Bertolotti-Ciarlet A, Crawford SE, Hutson AM, Estes MK. The 3′ End of Norwalk Virus mRNA Contains Determinants That Regulate the Expression and Stability of the Viral Capsid Protein VP1: a Novel Function for the VP2 Protein. J Virol. 2003;77(21).
6. Hardy ME, Estes MK. Completion of the Norwalk virus genome sequence. Virus Genes. 1996;12(3).
7. Donaldson EF, Lindesmith LC, Lobue AD, Baric RS. Viral shape-shifting: Norovirus evasion of the human immune system. Vol. 8, Nature Reviews Microbiology. 2010.
8. Bertolotti-Ciarlet A, White LJ, Chen R, Prasad BVV, Estes MK. Structural Requirements for the Assembly of Norwalk Virus-Like Particles. J Virol. 2002;76(8).
9. Green KY, Ando T, Balayan MS, Berke T, Clarke IN, Estes MK, et al. Taxonomy of the caliciviruses. In: Journal of Infectious Diseases. 2000.
10. Zheng DP, Ando T, Fankhauser RL, Beard RS, Glass RI, Monroe SS. Norovirus classification and proposed strain nomenclature. Virology. 2006;346(2).
11. Fukuda S, Sasaki Y, Takao S, Seno M. Recombinant norovirus implicated in gastroenteritis outbreaks in Hiroshima Prefecture, Japan. J Med Virol. 2008;80(5).
12. Schiff ER. Atypical clinical manifestations of hepatitis A. Vaccine. 1992;10(SUPPL. 1).
13. Marshall JA, Bruggink LD. The dynamics of norovirus outbreak epidemics: recent insights. Vol. 8, International journal of environmental research and public health. 2011.
14. Wollants E, van Ranst M. Detection of false positives with a commonly used Norovirus RT-PCR primer set. Vol. 56, Journal of Clinical Virology. 2013.
15. Fiore AE, Wasley A, Bell BP. Prevention of hepatitis A through active or passive immunization: recommendations of the Advisory Committee on Immunization Practices (ACIP). MMWR Recommendations and reports : Morbidity and mortality weekly report Recommendations and reports / Centers for Disease Control. 2006;55(RR-7).
16. Liu W, Zhai J, Liu J, Xie Y. Identification of recombination between subgenotypes IA and IB of hepatitis A virus. Vol. 40, Virus Genes. 2010.
17. Totsuka A, Moritsugu Y. Hepatitis A virus proteins. Vol. 42, Intervirology. 1999.
18. Pintó RM, Aragonès L, Costafreda MI, Ribes E, Bosch A. Codon usage and replicative strategies of hepatitis A virus. Virus Res. 2007;127(2).
19. Balayan MS. Natural hosts of hepatitis A virus. Vaccine. 1992;10(SUPPL. 1).
20. Lemon SM, Jansen RW, Brown EA. Genetic, antigenic and biological differences between strains of hepatitis A virus. Vaccine. 1992;10(SUPPL. 1).
21. Bower WA, Nainan O v., Han X, Margolis HS. Duration of viremia in hepatitis A virus infection. Journal of Infectious Diseases. 2000;182(1).
22. Koff RS. Clinical manifestations and diagnosis of hepatitis A virus infection. Vaccine. 1992;10(SUPPL. 1).
23. Fiore AE. Hepatitis A transmitted by food. Vol. 38, Clinical Infectious Diseases. 2004.
24. Krugman S, Giles JP. Viral hepatitis: new light on an old disease. Trans Assoc Am Physicians. 1970;83.
25. Gingrich GA, Hadler SC, Elder HA, Ash KO. Serologic investigation of an outbreak of hepatitis A in a rural day-care center. Am J Public Health. 1983;73(10).
26. Lednar WM, Lemon SM, Kirkpatrick JW, Redfield RR, Fields ML, Kelley PW. Frequency of illness associated with epidemic hepatitis a virus infection in adults. Am J Epidemiol. 1985;122(2).
27. Yang NY, Yu PH, Mao ZX, Chen NL, Chai SA, Mao JS. Inapparent infection of hepatitis A virus. Am J Epidemiol. 1988;127.
28. Lowther JA, Bosch A, Butot S, Ollivier J, Mäde D, Rutjes SA, et al. Validation of EN ISO method 15216 – Part 1 – Quantification of hepatitis A virus and Norovirus in food matrices. Int J Food Microbiol. 2019;288.
29. Butot S, Putallaz T, Sánchez G. Procedure for rapid concentration and detection of enteric viruses from berries and vegetables. Appl Environ Microbiol. 2007;73(1).
30. Patel MM, Hall AJ, Vinjé J, Parashar UD. Noroviruses: A comprehensive review. Vol. 44, Journal of Clinical Virology. 2009.
31. Kong BH, Lee SG, Han SH, Jin JY, Jheong WH, Paik SY. Development of enhanced primer sets for detection of Norovirus. Biomed Res Int. 2015;2015.
32. Baert L, Uyttendaele M, Stals A, van Coillie E, Dierick K, Debevere J, et al. Reported foodborne outbreaks due to noroviruses in Belgium: The link between food and patient investigations in an international context. Vol. 137, Epidemiology and Infection. 2009.
Received: 26 September 2022 / Accepted: 15 October 2022 / Published:15 February 2023
Citation: Salazar E J, Guerrero M J, Villaquiran J A, Suárez K S, Cevallos J M. Development of enhanced primer sets for detection of Norovirus and Hepatitis A in food samples from Guayaquil (Ecuador) by reverse transcriptase-heminested PCR. Revis Bionatura 2023;8 (1) 2. http://dx.doi.org/10.21931/RB/2023.08.01.2.
Vol11 No1 2026

INDEXADA EN
INDEXADA EN
